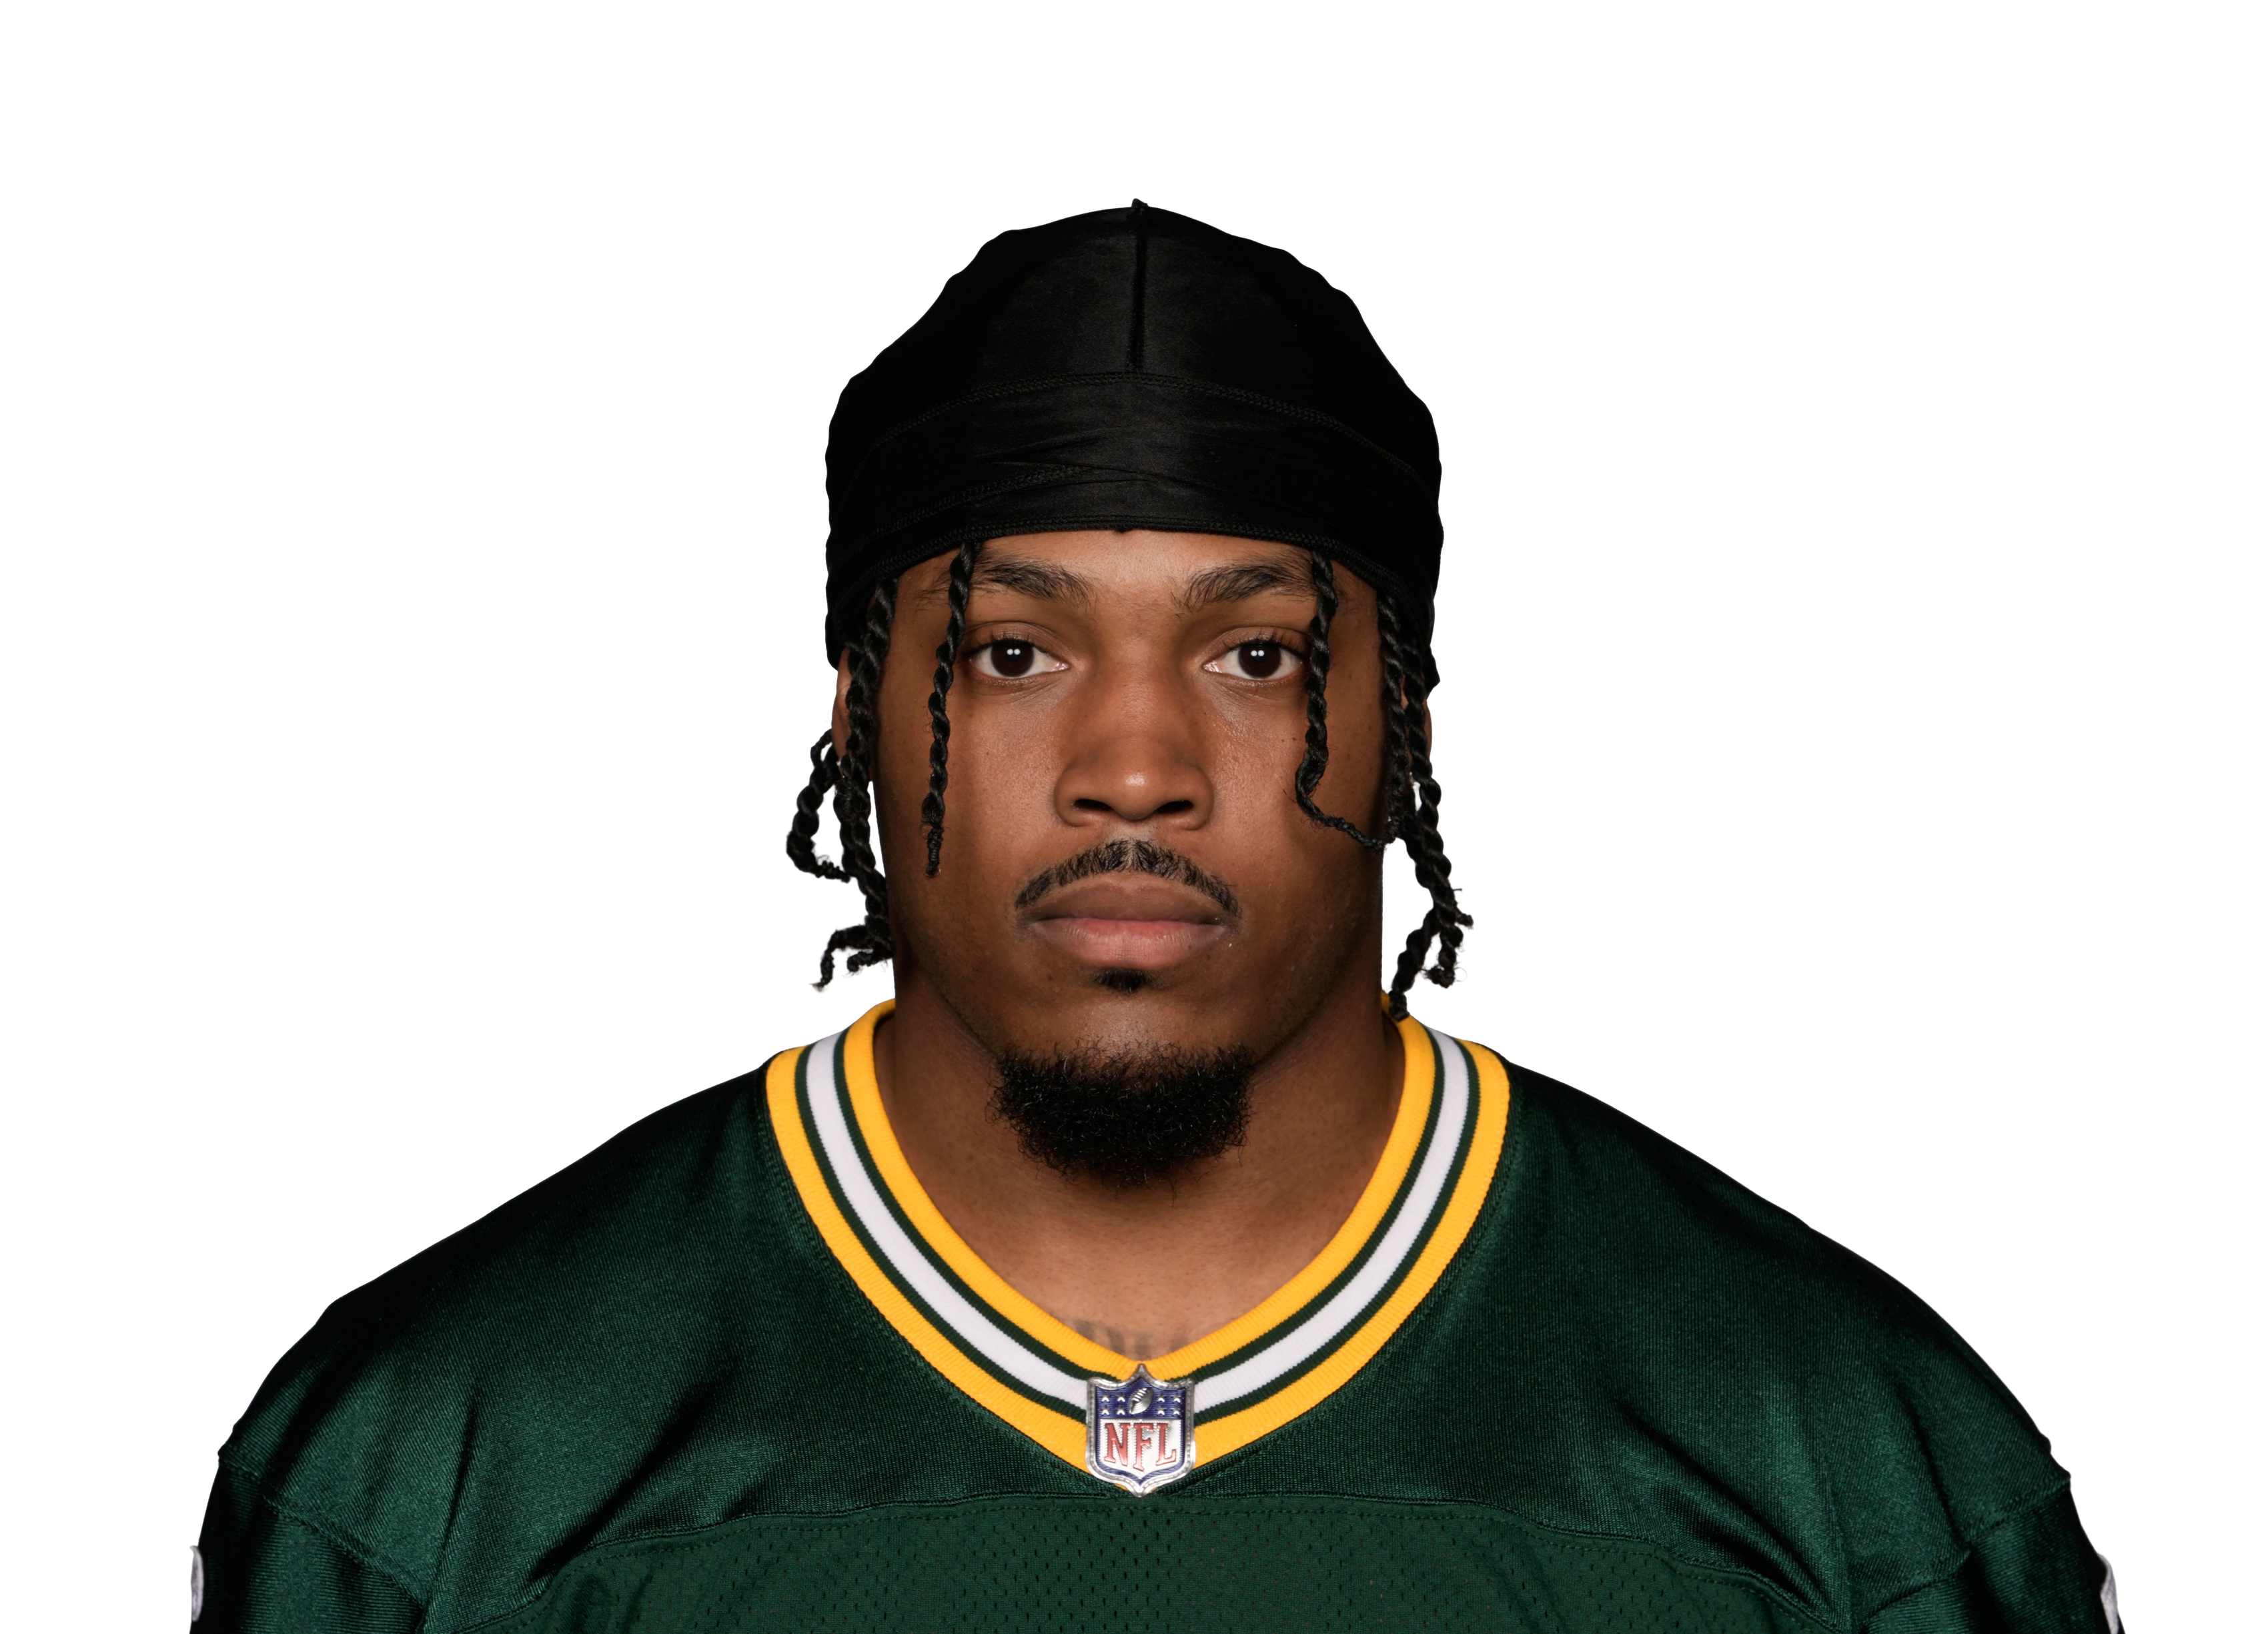
RB
Josh Jacobs
- Last 4 games
- 9.78 pts/game
- 2027 average
- 12.77 pts/game
- Trend
- ▼ -23%
His last 4 games, reaching back into 2026. The last 4 games are darker; the dashed line is his 2027 average.
Weekly finishes
- Top 12 weeks
- 2 of 3
- Top 24 weeks
- 2 of 3
- Top 36 weeks
- 2 of 3
- Average finish
- RB29
- Best finish
- RB11
| Season | Games | Top 12 | Top 24 | Top 36 | Avg finish | Best |
|---|---|---|---|---|---|---|
| 2027 | 3 | 2 (67%) | 2 (67%) | 2 (67%) | RB29 | RB11 |
| 2026 | 15 | 7 (47%) | 11 (73%) | 12 (80%) | RB21 | RB2 |
| 2025 | 17 | 7 (41%) | 16 (94%) | 16 (94%) | RB15 | RB2 |
| 2024 | 13 | 5 (38%) | 9 (69%) | 12 (92%) | RB18 | RB2 |
| 2023 | 17 | 9 (53%) | 14 (82%) | 17 (100%) | RB12 | RB1 |
| 2022 | 15 | 9 (60%) | 15 (100%) | 15 (100%) | RB12 | RB5 |
| 2021 | 15 | 9 (60%) | 15 (100%) | 15 (100%) | RB10 | RB1 |
| 2020 | 13 | 9 (69%) | 13 (100%) | 13 (100%) | RB8 | RB2 |
Where he ranked among all RBs each week he played, by this league’s scoring. The boxes are 2027.
Consistency
- Floor
- 9.6 worst 25%
- Typical
- 16.2 median
- Ceiling
- 18.3 best 25%
- 10+ points
- 65% of games
- 15+ points
- 53% of games
- 20+ points
- 24% of games
His last 17 games (a season's worth), until he has six this season.
Week 11 matchup: Bye
| Stretch | Games | Avg PPG by RBs | Avg matchup |
|---|---|---|---|
| Next 4 games | Wk 12 @LA, Wk 13 @NO, Wk 14 BUF, Wk 15 MIA | 21.3 pts/game | 13.0 |
| Fantasy playoffs (weeks 15–17) | Wk 15 MIA, Wk 16 @CHI, Wk 17 HOU | 20.0 pts/game | 15.3 |
| Rest of season | Wk 12 @LA, Wk 13 @NO, Wk 14 BUF, Wk 15 MIA, Wk 16 @CHI, Wk 17 HOU, Wk 18 DET | 19.8 pts/game | 17.0 |
Matchup of 1 is best and 32 is worst. Full schedule on the Season tab
Situations
| Split | Games | Pts/game | vs his average |
|---|---|---|---|
| Home | 48 | 15.24 | +3% |
| Away | 46 | 14.52 | -2% |
| Neutral site (international) | 1 | 11.40 | – |
| Dome or closed roof | 48 | 14.98 | +2% |
| Outdoors | 47 | 14.72 | 0% |
| Cold (40°F or below) | 9 | 11.54 | -22% |
| Windy (15+ mph) | 8 | 11.38 | -23% |
| After a bye | 6 | 18.00 | +22% |
| Thursday games (short week) | 8 | 18.00 | +22% |
| Division games | 36 | 15.54 | +5% |
| Grass | 69 | 14.80 | +0% |
| Artificial turf | 20 | 16.23 | +10% |
Every regular-season game on record since 2020 (108 games). Overall average 14.74 pts/game.
- With Jordan Love
- 16.04 pts/game, 32 games
- Without him
- 6.40 pts/game, 3 games
- Difference without
- -60%
| With | Without | |
|---|---|---|
| Targets per game | 3.1 | 0.7 |
| Carries per game | 16.3 | 16.7 |
| Red-zone looks per game | 4.1 | 2.3 |
| Snap share | 34% | 40% |
Games without him: 2026 wk 17 (0.8), 2025 wk 3 (5.3), 2025 wk 2 (13.1).
Only seasons they were on the same NFL team. “Without” means Jordan Love didn’t play that week (injury, rest or not yet with the team).
Usage
| 2027 season | Last 4 games | |
|---|---|---|
| Snap share | 46% | 46% |
| Target share | 11% | 9% |
| Air yards share | 3% | 2% |
| Touches per game | 15.7 | 13.0 |
| Carries per game | 12.0 | 10.0 |
| Targets per game | 4.3 | 3.5 |
| Rushing share of touches | 77% | 77% |
| Yards per touch | 3.1 | 2.9 |
| Catch rate | 85% | 86% |
| Points per opportunity | 0.78 | 0.72 |
| Red-zone carries per game | 4.0 | 3.3 |
| Goal-line carries per game | 1.0 | 0.8 |
| Red-zone targets per game | 1.7 | 1.5 |
| Share of team's red-zone looks | 52% | 47% |
| Red-zone touchdowns per game | 0.67 | 0.50 |
Opportunities are carries plus targets. Snap share comes from the NFL’s snap counts and can lag a day behind. Red zone is inside the opponent’s 20, goal line inside the 5; red-zone looks are carries plus targets, and touchdowns are his own rushing or receiving scores there.
Touchdown luck
- Red-zone TDs
- 14
- Expected
- 15.0 from his looks
- Difference
- -1.0 TDs
Touchdowns in line with his red-zone looks.
| Games | Red-zone carries | Goal-line carries | Red-zone targets | TDs | Expected | Difference | |
|---|---|---|---|---|---|---|---|
| 2027 season | 3 | 12 | 3 | 5 | 2 | 3.2 | -1.2 |
| Last 17 games | 17 | 59 | 22 | 11 | 14 | 15.0 | -1.0 |
| 2026 season | 15 | 52 | 20 | 6 | 13 | 12.5 | +0.5 |
Expected uses league-wide rates from every season on record: 42% of goal-line carries (inside the 5) score, 8% of other red-zone carries and 25% of red-zone targets. Rushing and receiving touchdowns only. Big gaps tend to even out.
Contract value
- Points per $1
- 1.04 per game
- Value rank
- 28 of 55 rostered RBs
- Scoring rank
- 18 of 55
- Salary rank
- 24 of 55
Outplaying his contract: 18th in points per game, 24th in salary among rostered RBs.
2027 season points per game against his $12.22 salary.
Age and contract outlook
- Age
- 28 this season
- Typical peak for RBs
- 24
- Years left
- 3 through 2029
| League year | Age | Salary | Typical change | Projected pts/game |
|---|---|---|---|---|
| 2027 | 28 | $12.22 | now | 14.3 |
| 2028 | 29 | $12.22 | -1.3 | 13.0 |
| 2029 | 30 | $12.22 | -2.4 | 12.0 |
The curve is how RBs scored from one season to the next at each age, averaged over every back-to-back pair of 8+ game seasons since 2017 (this league’s scoring). Projections start from his last 17 games and add the typical change; they say nothing about injuries or role.
Compare RBs
Pick one or two RBs to see them next to Josh Jacobs. The list is everyone at the position who’s played in 2027, best scorers first.